|
Calculated with XtalView. Map courtesy of S. Lee. |
The native Patterson map is simple to calculate. The only requirements are:
the crystal's unit cell parameters, your spacegroup operators,
and your data set output by scalepack.
I typically use the program xfft from the XtalView suite of programs.
The program produces a contoured map, which may be displayed
and re-contoured interactively in sections
along x, y, or z. There is a small investment in time to setup to
use XtalView (10 minutes). However, you only have to do it once. I have constructed
a web page to assist you in the setup . XtalView is an
especially useful suite of programs if you are solving a structure de novo.
I find it indispensible for looking at isomorphous difference Patterson maps
and anomalous difference Patterson maps. So, I think it is worth the time.
If you are setup to use CCP4 programs, you can calculate a native Patterson
with CCP4's fft program instead.
Manual for XtalView: Manpages or User guide
Reference for XtalView:
Reference for the Native Patterson Map:
|
|
|
|
|
If you are setup to use XtalView, you may proceed
as follows. If not, go here .
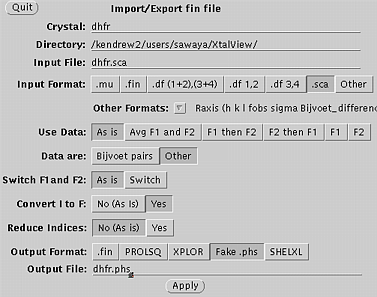
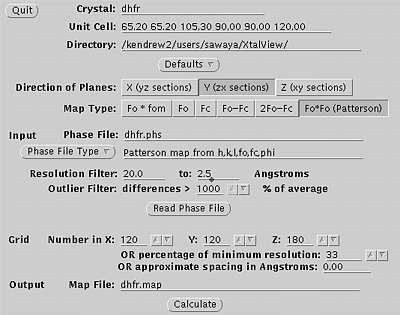
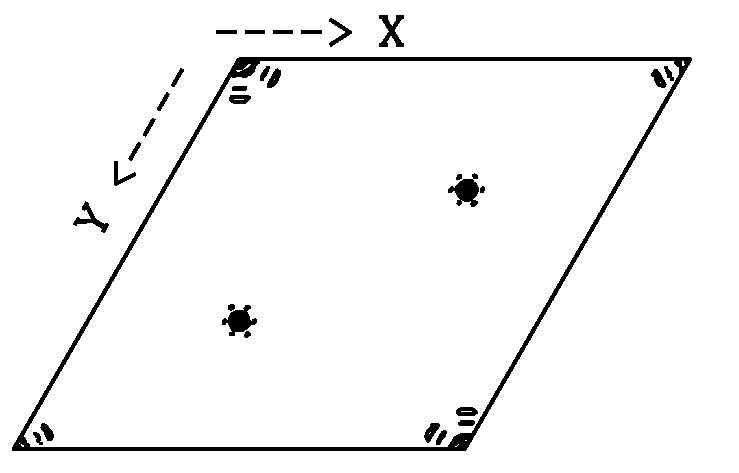
Use xprepfin to convert your scalepack file to .phs format. In this example type: xprepfin dhfr.sca dhfr.phs Choose the buttons such that: Input Format: .sca Convert I to F: Yes Output Format: Fake.phs Then press the "Apply" button. You should now have a .phs file in your directory. Use xfft to convert your .phs file to a Patterson map. In this example type: xfft dhfr.phs dhfr.map Choose the buttons such that: Map Type:Fo*Fo (Patterson) Type in your resolution range. Be sure to press Enter everytime you enter a new number. Press "Read Phase File" then press "Calculate" Xfft will automatically select grid units appropriate for your unit cell and resolution. You should now have a .map file in your directory. Display map with xcontur. In this example type: xcontur dhfr.map Press the "next" button to page through the sections of your map. Look for peaks over 5 sigma. The maps are automatically scaled so that a peak height of 50 is equal to 1 sigma. So look for peaks of height 250 (5 sigma). You can read the peak height by simply clicking on the peak. Be sure to select x, y, and z limits that cover your asymmetric unit. |
Xprepfin window, used in step one. 
Xfft window, used in step two. 
|
