Graphics Programs 
Choose the Graphics Program that Best Suits your Needs
subtitle: How to show off your model to the best advantage .
PYMOL

pymol images

Pymol

Pros:
1) Ray tracing gives a real 3D quality.  Background fog adds to the 3D effect and simplifies figures by hiding less important features in the background.
2) Can display molecular surfaces on the fly.
3)
Runs on PC or linux machines.  But, faster performance on linux.
4) Hardware stereo capability.
5) Displays X-plor format electron density maps.
6) Can display unit cell or dashed lines between atoms.

7) Can make movies in which your molecule rocks about the y axis.
8) Can show crystal packing.
9) If you write a pymol script, you can reproduce a figure by executing the script.

Cons:
1) Menus are clumsy and incomplete.  You need to learn pymol syntax to get anywhere.
2) Doesnt write out a pymol script.  You write it yourself.
3)
No built in capability to draw C-Alpha traces, although it can show backbone trace.

References: See Pymol web page - for links to manual, gallery, etc.
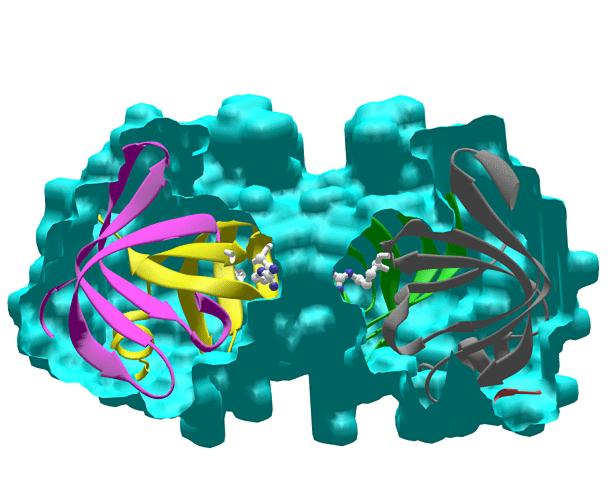

Ribbons- panoramic view

Ribbons
Pros: 
1) Beautiful ribbons display; ribbon style can be interactively customized. 
2) Can display masks or molecular envelops with nice shadow effect.
3) Makes nice figures of DNA too.
4) Works on a DEC Alpha station, (but some features only work on SGI machines).
5) Quick interactive control over Orientation and ribbon dimensions.

Cons:
1) No facility for drawing H-bonding schemes or distances.
2) Customizing color schemes for ribbons, spheres or bonds requires tedious file editing.
3) Antialiasing only works on SGIs.
4) No labeling facility.
5) No interactive control over which side chains to display.

References: M. Carson (1997) Ribbons. Methods in Enzymology 277:493-505, R.M. Sweet and C.W. Carter, eds, Academic Press


Molscript/Raster3D

rendered by raster3d

Molscript/Raster3D
Pros: 
1) Beautiful ribbons display. 
2) Nice shadow effect.
3) Works on a DEC Alpha station, (Linux version not yet installed).
4) Scripted.

Cons:
1) Syntax is agonizingly complicated. Lack of examples in manual.
2) Takes lots of script editing. The only interactive component involves
finding a pleasing orientation.

3) No fog effect.
4) Labeling facility is complicated.
5) No interactive control over which side chains to display

References:  Merritt, Ethan A. and Bacon, David J. (1997). "Raster3D: Photorealistic Molecular Graphics"277, 505-524. Methods in Enzymology

SETOR

SETOR (pronounced see-tor)

Pros:
1)displays secondary, tertiary and quaternary structures of protein and nucleic acid macromolecules.  
2) interactive control of all or a subset of atoms in the molecule, and can be used to generate high-quality lighted models of solid surfaces or wire frames.
3) choice of combining color and depthcue gradient to alter the appearance.
4) control of the appearance of the model increases dramatically as now the range of parameters includes the light scattering properties of the model surface such as ambient and diffuse reflectance, shininess, etc.
5) he user also controls the color, intensity and position of the light sources, as well as the quality of the overall lighting present in the scene
6) `ray traced' surfaces can be manipulated interactively. 
7)  provides control over almost every program parameter viamouse activated dialogue boxes.
8) very user-friendly and you probably won't even have to read the manual, but one is available, just in case.

Cons:
1) For all the reasons given above, I think that Setor is THE BEST graphics program for making figures. But it runs only on SGI machines.  SGI machines are regarded as relics of antiquity and are found only in hidden recesses of UCLA. Please! Oh please make a linux version.

References: SETOR: Hardware-lighted three-dimensional solid model representations of macromolecules. S.V. Evans. J Mol Graph (1993) Jun;11(2):134-8, 127-8 evans@flint.biochm.uottawa.ca

Ligplot


References:


[Overview] · [Facilities] · [People] · [Services] · [Lectures] · [BioLinks] · [Stats] · [Search]