|
|
|
|
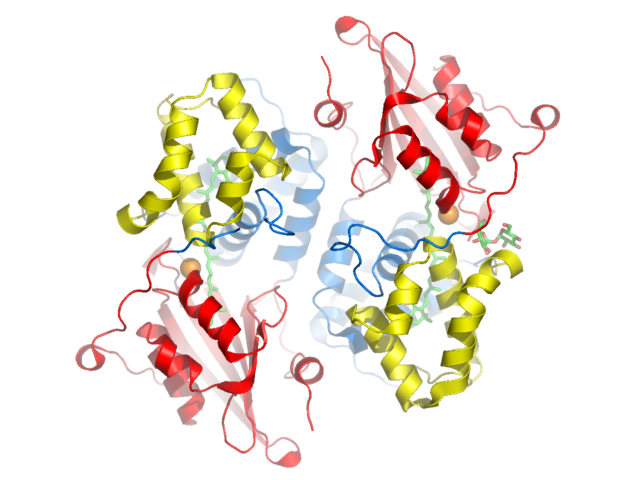
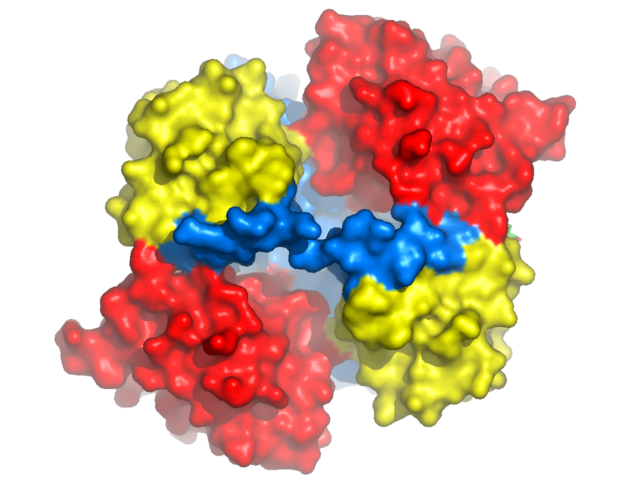
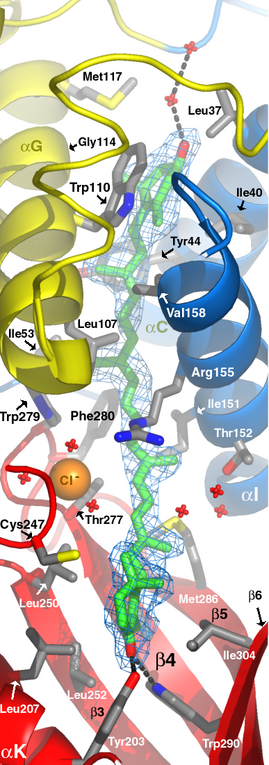 Orange carotenoid protein from Arthrospira Maxima. Labels added using Photoshop. |
The Pymol software interactively displays molecular models and
creates publication quality images. A `ribbon drawing' is featured here.
Space-filling, ball-and-stick representations, molecular surfaces, density
map contours, and crystal packing diagrams, and movies are also supported.
Coordinate files must be in Protein Data Bank (*.pdb) format. Maps should
be in X-plor format (*.xplor). It is recommended that you make a new
directory to begin.
Requirements: Manual for Pymol: HTML or PDF version Pymol Website: Further Examples of images from Pymol:
FAQs mailing list: Reference for Pymol: DeLano, W.L. The PyMOL Molecular Graphics System (2002) DeLano Scientific, |
|
|
|
|
STEP ONE Log into a Linux or PC machine. Get coordinates for orange carotenoid protein, 1M98.pdb. Download this pymol script, pymol1.pml. It is a copy of the script shown below. Read the comments associated with each command below to familiarize yourself with pymol language. #BEGIN PYMOL SCRIPT # antialias =1 smooths jagged edges, 0 turns it off set antialias = 1 # stick_radius -adjust thickness of atomic bonds set stick_radius = 0.3 # mesh_radius -to adjust thickness of electron # density contours set mesh_radius = 0.02 # bg_color --set the background color bg_color white # load pdb file and give it an object name load 1M98.pdb, ocp # hide nonbonded atoms (i.e. waters) hide nonbonded # show cartoon ribbons show cartoon # Hide the default line representation of atomic bonds hide lines # Use standard helix, strand, and loop representations # other possibilities: cartoon loop, cartoon rect, # cartoon oval, and cartoon tube cartoon automatic # If you dont have secondary structure assignments # in the PDB header then uncomment the following # line to detect secondary structure. # Warning, very coarse approximation. # Or get header from http://www.mbfys.lu.se/Services/SecStr/ #util.ss ocp # Make fancy helices with ridge on the edges like # molscript does # 1 is on. 0 is off. set cartoon_fancy_helices=1 # Make the strands flat=1 or pass through CA positions=0 # Set to 0 when showing side chains from a strand set cartoon_flat_sheets = 1.0 # Draw the loops smooth=1 or pass through CA positions=0 # Set to 0 when showing side chains from a loop set cartoon_smooth_loops = 0 # Set the color of the residues # to find the names of the colors available # click on the rainbow colored square in the # upper right corner of the graphics window color red, (resid 2:18) color red, (resid 176:317) color marine, (resid 19:54) color marine, (resid 122:175) color yellow, (resid 55:124) color orange, (resid 402:403) # Show spheres for chloride ions show spheres, resid 402:403 # Show sticks for bonds show sticks, (resid 401 or resid 350 or resid 351) ### cut below here and paste into script ### Execute the pymol script by typing: pymol pymol1.pml STEP TWO Orient your model and adjust the fog effect
for depth cue. Use the mouse to rotate and translate the view.
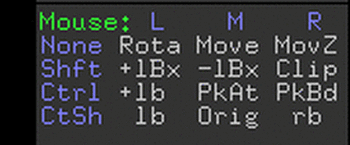
There is a key understanding the mouse controls in the lower right
corner of the graphics window. Some examples, To translate (move) the molecule hold down
the middle mouse button and drag the mouse. To rotate about the Z axis, place the
cursor near one of the corners of the image then hold down the left mouse
button and drag the mouse. To rotate about the X/Y axis, place
the cursor near the center of the image then hold down the left mouse button
and drag the mouse. Once you have a view that you like, adjust
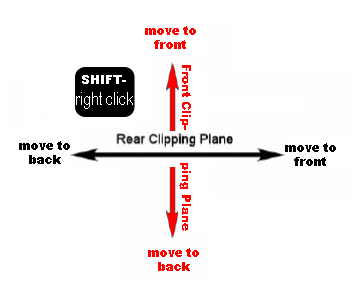
the fog by changing the front and rear clipping planes. See figures
3 and 4. Rear clipping plane- hold down the shift key
and the right mouse button and drag the mouse to the right. You should
see the fog grow stronger. Front clipping plane- hold down the shift
key and the right mouse button and drag the mouse toward you. You should
see the clipping plane come into view. Adjust the front and rear clipping
plane to focus on the area of the molecule you wish to display. Press the "get view" button on the pymol graphics
window. You will see a matrix written to the screen. Hilight
this matrix with the mouse and press CNTRL + C to copy. Paste this
matrix at the bottom of the script to save the view and orientation that
you chose. Use your favorite editor to make
a pymol script file. I use "vi" on linux, or "wordpad" on the PC.
The next time you execute this script, you will automatically
return to this view. Example of matrix from "get view" ### cut below here and paste
into script ###
Displaying a Molecular Surface show surface, ocp
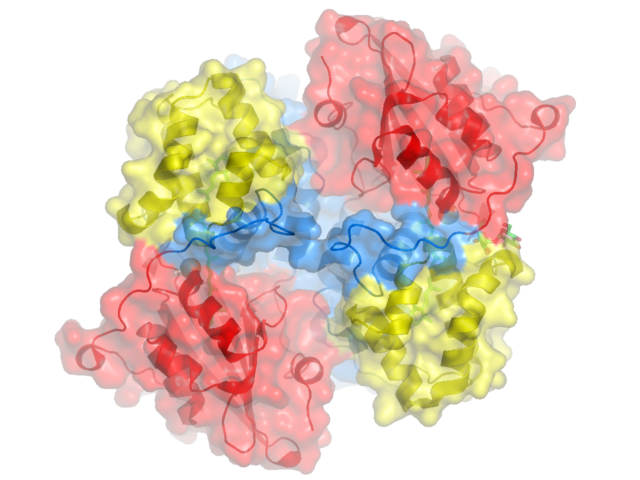
Displaying a Transparent Molecular Surface show surface, ocp
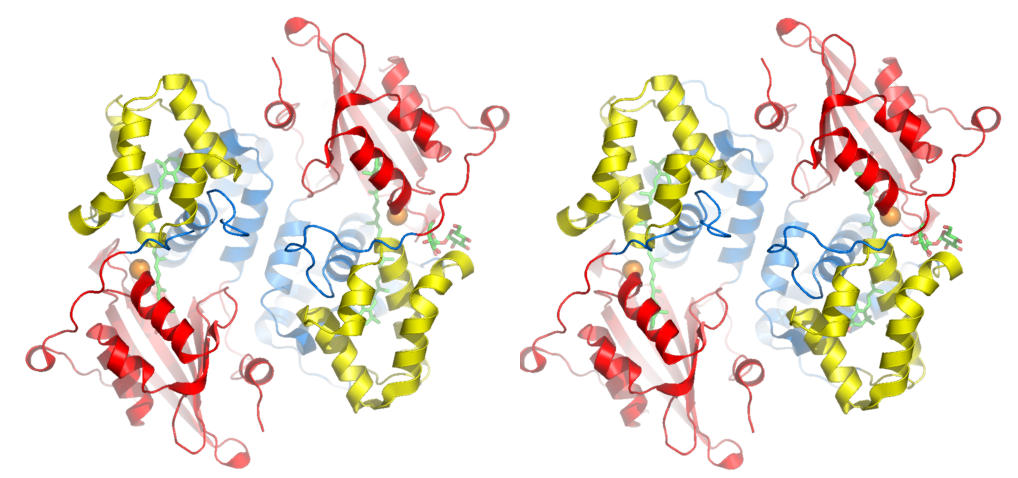
You have
to make two images, right and left. Then
merge the two images together in photoshop.
For right image: ray png pymo_right.png For left image: turn y, +6 ray png pymol_left.png Or for perfectionists try: ray angle=-3 png image1.png ray angle=3 png image2.png This is superior to using the "turn" command because it also rotates the light source. That way shadows will look right. Making Labels You can
select the residue and atom where the label will be placed.
But, these labels are pretty crude. I recommend that you use photoshop for labeling figures for publication. Make label for carotenoid: label ( resi 350 and name; c16), "carotenoid 1 " label ( resi 351 and name; c16), "carotenoid 2" label ( resi 401 and name; c1), "sucrose " set label_color =1 Color by Secondary Structure
or Atom Type
You can
select the residue and atom where the label will be placed.
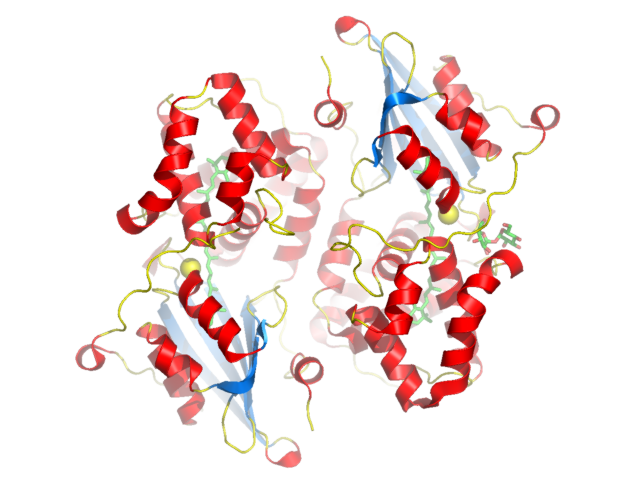
color red, ss hcolor marine, ss s color yellow, ss l+'' # to color ligands by atom color use util.cbag # Other functions are cbag, cbac, cbas, cbap, cbak, cbaw and cbab # (grey (carbon), cyan, salmon, purple, pink, white (hydrogen) and slate) util.cbag ocp and (resid 350:351 or resid 401) |
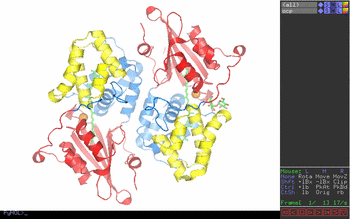
Figure 1. Pymol window obtained
in step one.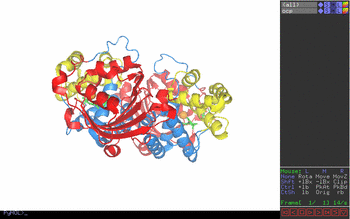 Figure 2. Key to Pymol mouse controls. Figure 3. Control of front and rear clipping planes. Figure 4. Pymol window obtained in step two. View chosen
to illustrate two-fold symmetry of dimer. Figure 5. After ray tracing (step 3) the edges are smoothed
and shadows are cast. Beauty! Pymol's molecular surface display. Molecular surface rendered 50% transparent.
colored by secondary structure |
