|
|
|
|

|
Using SHELXD:A
sample
script for running SHELXD is given below. The program runs on Linux
machines (e.g. lorentz.mbi.ucla.edu) not on DEC alphas. Isomorphous or
Anomalous differences are input in HKL format. To make the proper HKL format
file, you may first use xprep. Xprep also runs only on linux machines (e.g.
lorentz.mbi.ucla.edu). Xprep will accept Scalepack output and also produce
some useful statistics which will help you chose the optimum resolution
range to use in SHELXD. A
guide
for using xprep is also given below. Example
output from SHELXD is also given below.
Manual for SHELXD:
Manual for SHELX:
SHELXD Workshop:
xprep help file:
reference for SHELXD (pdf file):
|
|
An example, using anomalous differences. |
|
|
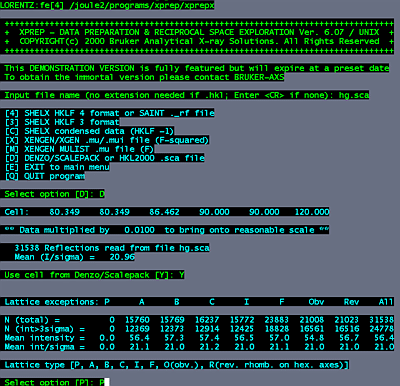
Log into a linux machine (e.g. telnet lorentz). change directories to where your scalepack files are. cd ~sawaya/data/sawaya/fe To execute the program, type: /joule2/programs/xprep/xprepx type in the name of the scalepack file: hg.sca select option "D for DENZO/SCALEPACK format input. Yes. Use the cell from the Scalepack file.
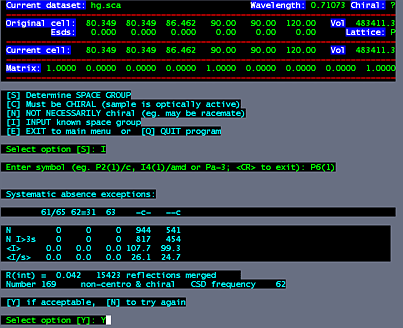
In this example, the space group is P61, so select "P" for primitive. Select option "S" to input space group information. Select option "I" to input known space group. In this example, type, "P6(1)". Select "Y" to accept your choice.
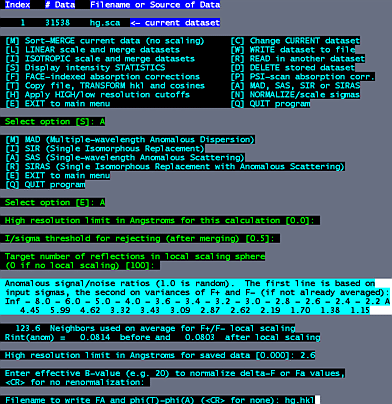
Select option "D" to read, modify or merge DATASETS. Select option "A" for MAD, SAS, SIR or SIRAS. Select option "A" for SAS. We are using anomalous differences in this case. At this point, accept the defaults for the next three questions by hitting the enter three times. The anomalous signal/noise ratio is given in resolution shells. The signal is significant to about 2.6 Angstroms, where signal/noise drops to just under 2.0. So at the next prompt, we cut the data to 2.6. Hit the enter key for no renormalization, then type a filename for the output hkl file. (e.g. hg.hkl) |

|
|
An example, using anomalous differences. |
|
|
Log into a linux machine (e.g. telnet lorentz). Change directories to where your hkl file is. cd ~sawaya/data/sawaya/fe Copy the following script into a file called "hg.ins". The first part
of the name corresponds to the hkl file and the extension must end in ".ins",
meaning "instruction" file.
PATS
HKLF 3
To execute SHELXD, (login to lorentz) type
The program will finish in about 10 minutes. You can see a summary of the results for each trial as the program runs. Here we see results from try 19, 20, and 21. Note PATFOM and CC as the summary goes by on the screen. The best solution will have the highest PATFOM and CC. --------------------------------------------------
|
CELL -- Wavelength followed by unit cell dimensions. The wavelength has no importance in this calculation. ZERR -- Number of asymmetric units in the unit cell, followed by estimated errors in the unit cell dimensions. Estimates do not have to be accurate. LATT -- Primitive is "-1", C centered is "-7", I centered is "-2", F centered is "-4". The negative sign indicates that the structure is non-centrosymmetric. SYMM -- Symmetry operators. The operator X,Y,Z is always assumed, so may NOT be input. If your structure is C, I, or F centered, do not put the lattice centering operators. These operators are specified by the choice of LATT, above. See this list of symmetry operators for your space group. SFAC -- The element symbol defining the heavy atom. The first 94 elements of the periodic table are recognized. UNIT -- The number of heavy atom in the cell. A ball park figure, can be larger than what you expect. PATS -- Generates starting atoms consistent with Patterson. It is "slightly" better than starting from random positions. FIND -- Number of atoms to find. Just a guess. NTRY -- Number of trials. If not specified, the program will run forever. I have found that if you don't get a decent answer in 50 trials, you will probably never get it. Find a better derivative. MIND -- The shortest distance allowed between atoms for PATS and FIND. Here it is set to 3 Angstroms since it is unlikely that two heavy atom sites would be closer than this. The negative sign is used as a flag to output a crossword table in the log file. The crossword table is important for judging the quality of the solution. Keep MIND negative. SHEL -- Resolution limits. HKLF -- Set it to 3 for F or FA or deltaF (e.g.
output from xprep). Set it to 4 for F2 in .hkl file.
|
|
|
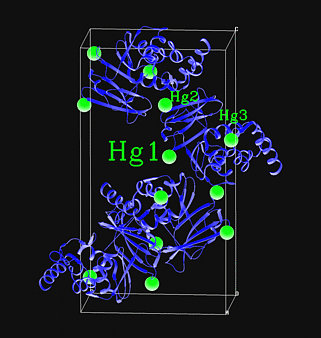
| Here is an exerpt from a SHELXD log file obtained using
the input above (i.e. from the Hg derivative of T7 helicase domain in space
group P61). This is Try 20, which has the best PATFOM of all
50 trials.
Some definitions: PATFOM- Patterson figure of merit, useful for selecting the best solution. Higher is better. CC -Correlation coefficient. Higher is better. Crossword Table -In this table the rows correspond to the potential atoms. They are listed in order of peak height. Reading across a row, peak height is given first, then x,y,z for the atom, then the distance (D) between this atom and its crystallographic symmetry mate. Just below D is the PMF (Patterson minimum function) calculated from all vectors between the this atom and its crystallographic symmetry mate. When this number is large and positive there is a good correlation between the heavy atom position and the Patterson map. When this number is 0, then there is no correlation, and the heavy atom site should be discarded. For each successive row, there is an additional column to the right which describes the cross peaks between the heavy atom and its neighbors. Look at the PMF values. In general wrong sites can be recognized in this table by the presence of several zero PMF values. In the example below, the first five sites look quite convincing, PMF
values are large and positive for both self peaks and cross peaks. The
sixth and seventh sites look weeker, the self vectors are 0.0, suggesting
that these sites should be discarded. Site eight looks OK and site nine
should definitely be discarded.
--------------------------------------- PSUM 76.48 PSMF Peaks: 33 18 17 16 13 11 10 10 10 10 9 9 9 8 8
PATFOM 18.22
Minimum distances (top row, 0 if special position) and PSMF (bottom
row)
CROSSWORD TABLE
99.9 0.3922 0.6070 0.0543 32.2
99.2 0.6715 0.8123 0.1027 27.1 20.6
96.1 0.4569 0.5916 0.1336 37.6 9.1 17.7
94.3 0.7888 0.2350 0.1236 34.2 15.3 18.4 19.3
81.0 0.5983 0.7913 0.0388 31.5 15.8 7.6 16.5 22.0
76.6 0.7887 0.0872 0.0711 25.8 26.8 12.3 20.2 12.7 19.1
68.6 0.3315 0.4764 0.1483 36.9 12.2 27.4 9.8 17.9 25.4 27.5
65.1 0.6274 0.8109 0.0994 29.7 18.2 3.5 16.3 17.3 5.6 13.9 25.8
63.6 0.7473 0.3837 0.0642 30.4 13.8 25.2 19.4 14.8 19.7 25.7 21.8 22.3
|

