Phasing, Density Modification, &
Electron Density Map Calculation
Structural Molecular Biology Laboratory, ChemM230D
|
3rd Assignment:
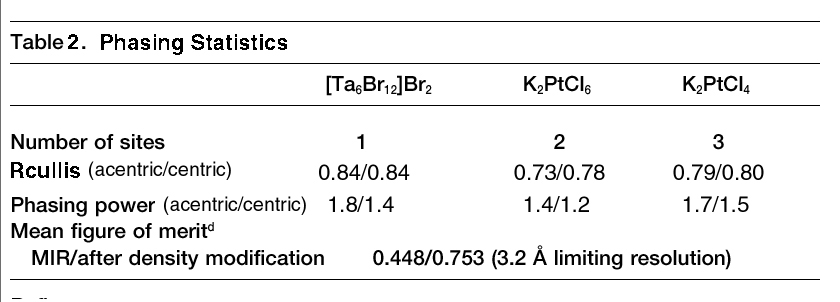
Phasing
Statistics Table
due week
of February 16, 2004 |
Illustrations
|
| Objective: To report phasing statistics
describing your first experimental electron density map.
Method: For each derivative, report
the number of heavy atom sites, Rcullis (centric/acentric), Phasing power
(centric/acentric), and the overall figure of merit (before and after density
modification) from the log file of MLPHARE. Submit your Table 2 to
Mike or Duilio by Tuesday, February 19, 2002. See notes below on the
meaning of these phasing statistics and what the values of these phasing
statistics are in the case of good/bad quality phases.
|
An example from assignment three. Adapted from Steegborn et al., 2001.
Crystal Structure of Transcription Factor MalT DomainIII: A Novel Helix Repeat
Fold implicated in Regulated Oligomeriztion, Structure, Vol. 9, 1051-1060. |
|
|
Part One:
Verify
your heavy atom coordinates. |
Illustrations
|
| Objective: To verify that the heavy atom
coordinates that you calculated are consistent with the experimental isomorphous
difference Patterson map.
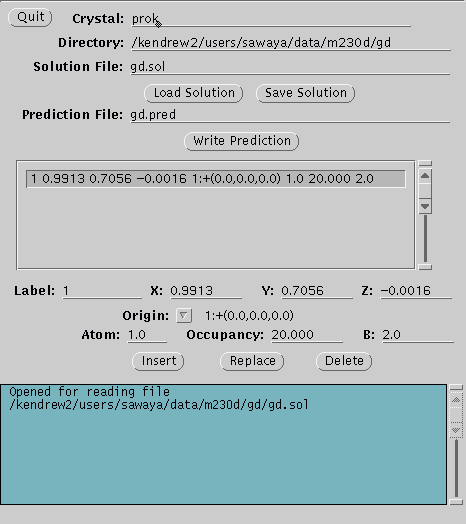
Procedures:
Open a Konsole window. Change directories to your personal working
directory. Here, you will find the Eu anomalous difference Patterson map
(eu.map), calculated as you did in the last meeting, but this time using
the XtalView xfft GUI. Make a file containing the coordinates for your
heavy atom (e.g. eu.sol). Now use XtalView's xpatpred GUI to convert
these XYZ coordinates to UVW coordinates of Patterson space (xpatpred eu.sol
eu.pred). Display the difference Patterson map with the coordinates
of the predicted Patterson peaks superimposed (xcontur eu.map eu.pred).
If your heavy atom coordinates were correct, there will be a cross
mark over all the major peaks in the difference Patterson map.
|
|
Part Two:
Calcluate
Phases and Choose Handedness |
Illustrations
|
| Objective: To refine heavy atom
positions, calculate phases, and calculate electron density maps.
Strategy: The quality of an
experimental electron density map will generally improve with the number
of derivatives added to the phasing calculation. To combine the heavy
atom derivative data sets FPH1,
FPH2, FPH3,
etc. for phasing two tasks must be accomplished (1) determining the correct
handedness of the heavy atom model and (2) placing the heavy atoms from each
derivative on the same origin. Both tasks can be accomplished using
the cross-difference Fourier method. In this method, protein phases (aP) are first calculated using the native data
set (FP) and structure factors and
anomalous differences from only one of the heavy atom derivative data sets
(FPH1 and DPH1). (These phases are refered to
as SIRAS phases because they are calculated using single isomorphous replacement
with anomalous scattering.) A cross-difference Fourier map is then calculated
using coefficients FP-FPH2and phases aP.
The highest peak on this cross-difference Fourier map should correspond to
the metal position of the second derivative (PH2). However, there is a 50/50
chance that we chose the incorrect hand of the first heavy atom (i.e. the
heavy atom positions used for the phasing calculation). We can judge
whether the handedness we chose is correct by comparing the height of the
highest cross-difference Fourier peak with the height of the highest peak
from a second cross-difference Fourier map. The second map has the
same coefficients as the first cross difference Fourier map (FP-FPH2)
but with phases aP obtained from
using the opposite hand of the first heavy atom (i.e. -x-y-z instead of x,y,z)
. The cross difference Fourier map that produces the highest peak is
the correct hand. You may have expected that the peak heights in the
two cross-difference Fourier maps would be identical because of Friedel's
law. That is, the phases of the protein calculated in either of the opposite
hands should differ by only a negative sign. Hence, you would expect
the cross difference Fourier peaks to be the same height in either hand.
But, as you will see from the experimental evidence this is clearly not true.
The reason that there is a small but significant difference in peak heights
is due to the anomalous scattering contribution DPH1
used in calculating the protein phases. So the protein phases output
in the two phasing runs differ by more than just a negative sign (though
not by much more).
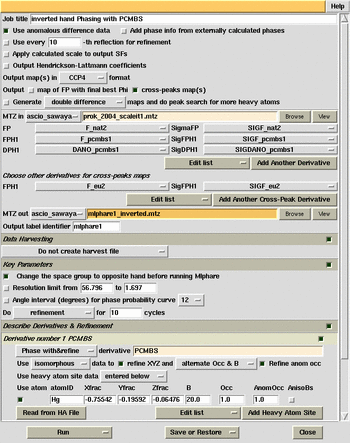
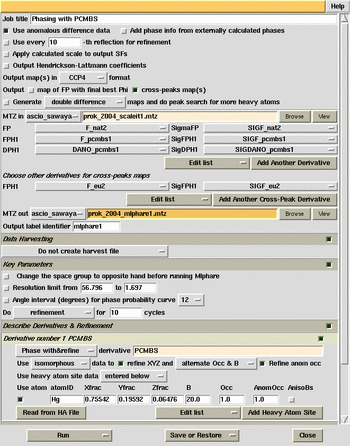
Procedures:
Calculate SIRAS (single isomorphous / anomalous scattering) phases using
the Europium position and calculate the cross difference Fourier map to find
the pHMBA sites all in one script. Choose the MLPHARE button
in the CCP4 GUI. Choose cross peak maps option. Input coordinates
for the Europium site (negate all signs), then select the option to "change
the space group to opposite hand before running Mlphare". Look at the
log file. Peaks from the cross difference Fourier map will be listed
in decreasing order, with the highest peak on the top. Note the position
and height of the top peak. Now, repeat the calculation but DEselect
the option to "change the space group to opposite hand before running Mlphare".
Note that the highest peak in this run is higher than in the previous run.
Therefore, the space group should NOT be changed to the opposite hand.
Note the position of the highest peak and use these coordinates as the pHMBA
site to input in the COMBINED phasing calculation. Because the coordinates
for the pHMBA site were taken from a difference Fourier map, they will be
on the same origin as the Eu. Deselect the option for cross-peaks maps.
Add a second derivative to the list by pressing the button to "Add Another
Derivative". Input the heavy atom site for the pHMBA. Look at
the log file and record the phasing statistics.
|
MlPhaRe phasing and
cross-difference Fourier calculation (inverted hand).
MlPhaRe phasing and
cross-difference Fourier calculation (original hand).
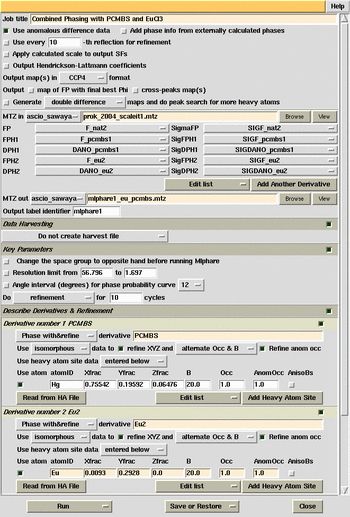
MlPhare phasing combined Eu and pCMBS derivatives.
|
Part Three:
Density modification and Map calculation. |
Illustrations
|
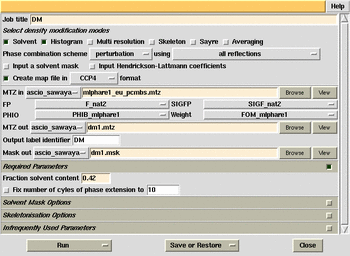
| Objective: To improve the
experimental phases by imposing some constraints on the electron density
distribution.
Procedures:
Use the DM window in the programs list of ccp4i. Run mapman.com.
View map with O. Use @omacro. See bones. Use stereo glasses.
|
A command file to extend the electron density map to cover the unit cell,
produce bones, and convert to O format. To run it, type mapman.com
ccp4mapfilename
#!/bin/csh -f
#
extend MAPIN $1 MAPOUT dm.ext << END-extend
XYZLIM 0 1 0 1.0 0 1
SYMMETRY P43212
END-extend
mapman -b mapsize 10000000<<eof
re m1 dm.ext ccp4
no m1
map m1 dm.omap
bo sk m1 1.3 0.7 100
bo co dm.odb skl 5
quit
eof
|
|
|
|
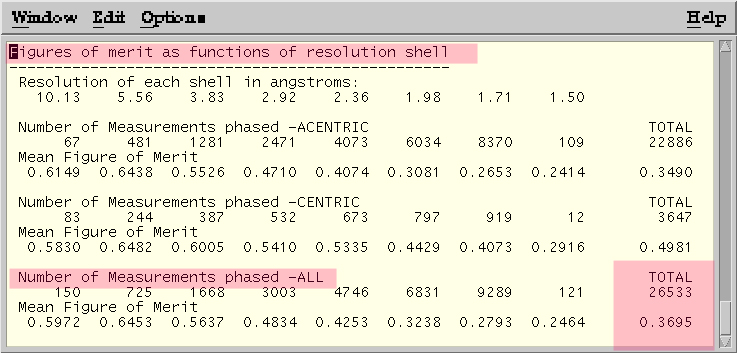
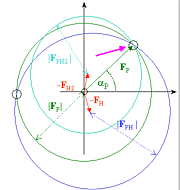
Figure of Merit statistics from MLPHARE log file. Phasing with Hg only.
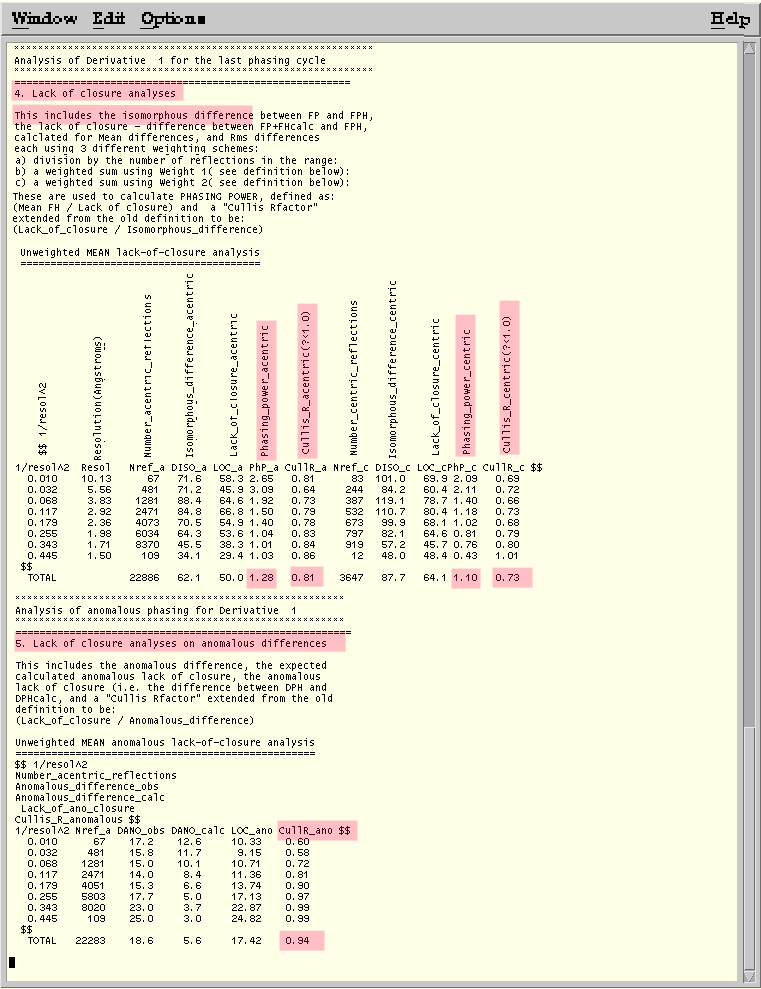
Lack of Closure Analysis from MLPHARE log file --Phasing on Hg only.
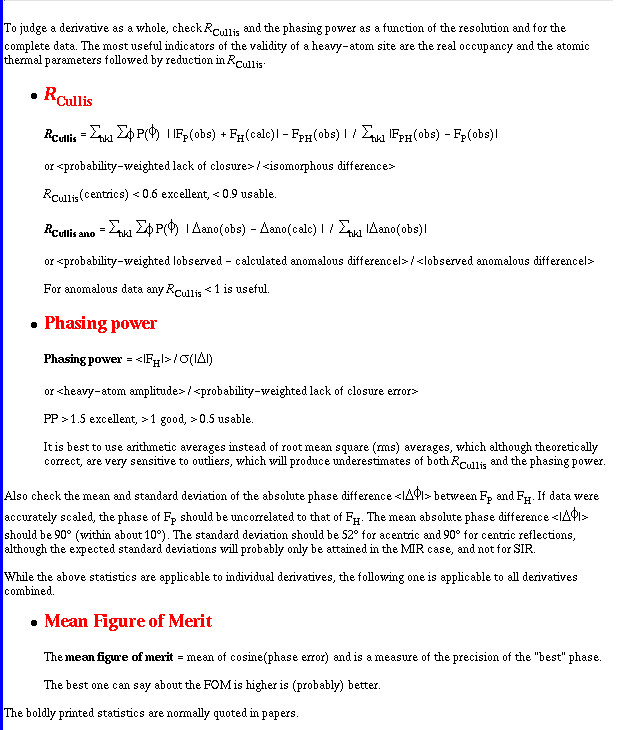
Taken from http://public-1.cryst.bbk.ac.uk/xtal/mir/stat2.htm.
Instructor's preparations
Back to CHEM
M230D course syllabus
[Overview] ·[Facilities] ·
[People] · [Services]
·[Lectures] ·
[BioLinks] ·
[Stats] ·[Search]
|
|
|