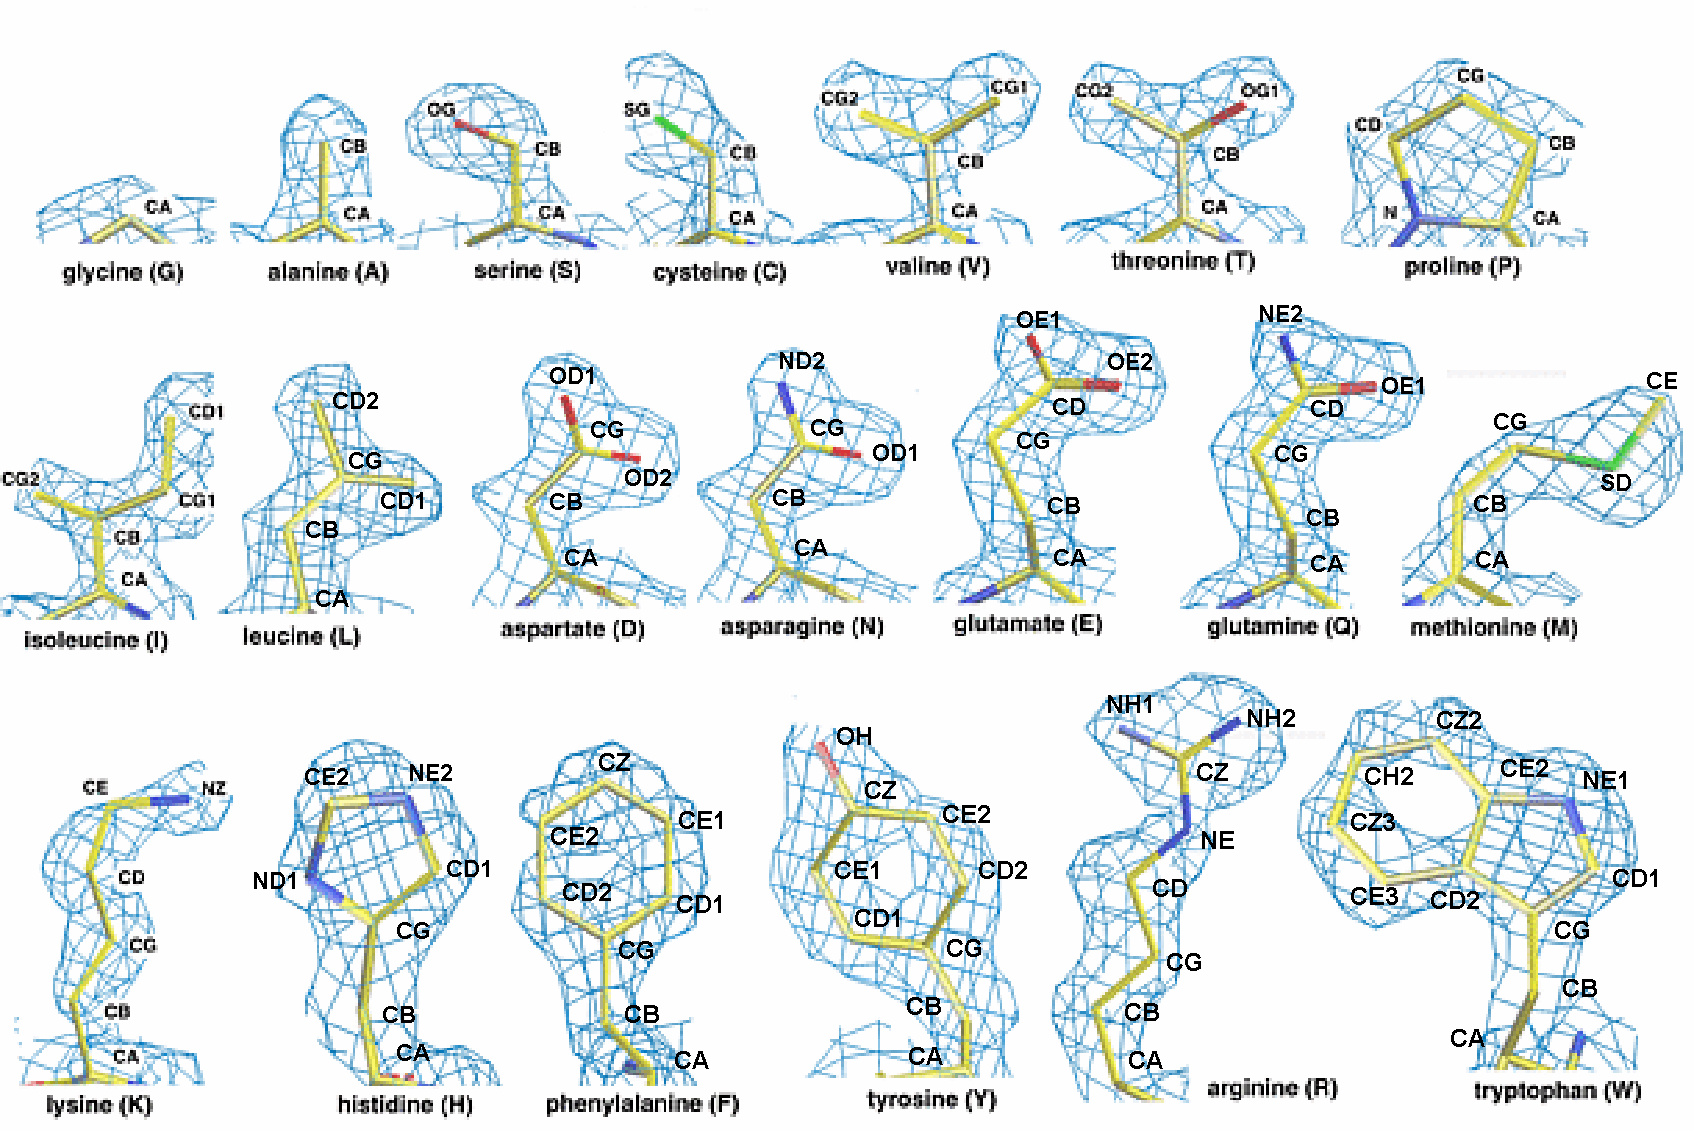
| Objective: To orient an alpha helix properly
in electron density.
Background: Recent advances in crystallographic
software have made it possible to build a protein chain entirely automatically
by the program ARP/wARP if the
native data set exceeds 2.3 Angstrom resolution or by the program "MAID" if the data exceeds 2.5
Angstrom resolution. In these cases, the job of the crystallographer
is reduced to that of tying up loose ends left by the refinement program.
If however, the native data is below medium resolution, the chain trace must
be performed manually by the crystallographer. One generally begins
by modeling secondary structure elements (i.e. alpha helices and beta
strands). Coordinates of idealized helices
and strands
may be downloaded and read in to the graphics program O.
The structural elements may then be grabbed and dragged into electron density.
Procedures: Type the word "ono"
to start the "O" graphics program. Press the "enter" key until the graphics
window appears. In the graphics window type @dmacro.
This instruction file will place a polyalanine helix in the middle
of a clock face. Use the grab group command to rotate the helix so
that the c-terminus of the helix points to 3 o' clock. Then translate
the helix into a box on the right of the screen. Once you have mastered
the rotation and translation of protein fragments, you may proceed to fitting
atomic models into electron density. 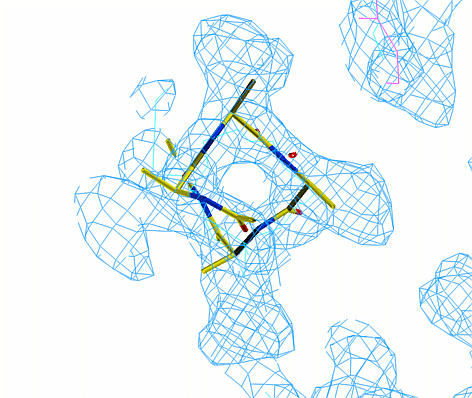 In the graphic window type "@mbmacro".
This command will read in a poly alanine starting model and a few libraries
that will aid in model building. Tear off the following sub-menus form
the "menus" menu: Objects, User, Fake Dials. You should be able to see
three objects: the poly alanine model (prok1); the solvent flattened electron
density (dm); and the unit cell outlined in red. You will see two parts
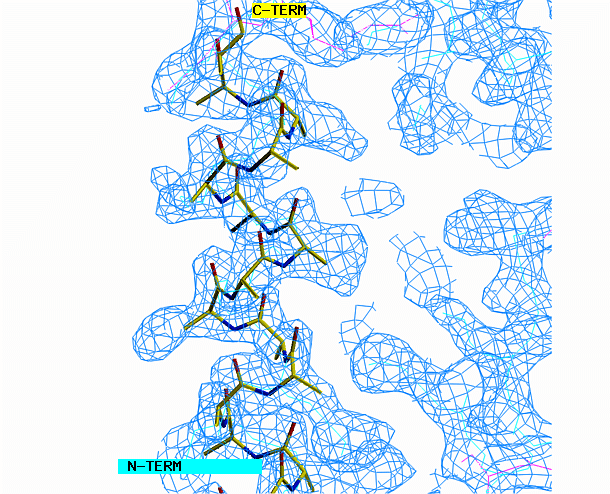
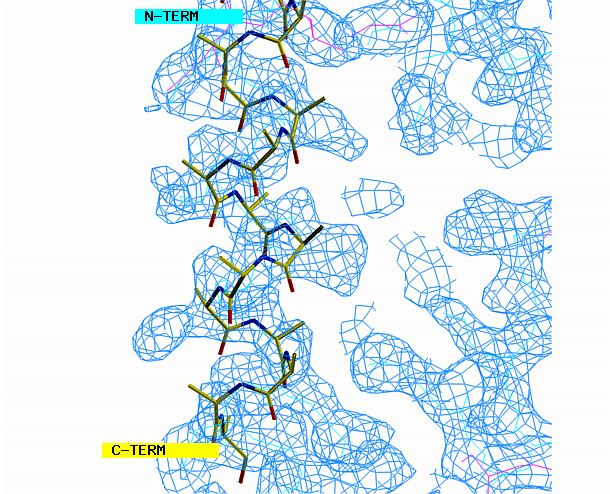
of the density map which contain no model. One area requires a helix,
the other area requires a beta strand. Begin with the alpha helix. Select
from the menu REBUILD , GRAB, GRAB GROUP, the click on the helix. Drag
the helix model toward the corresponding density. Look at the helix
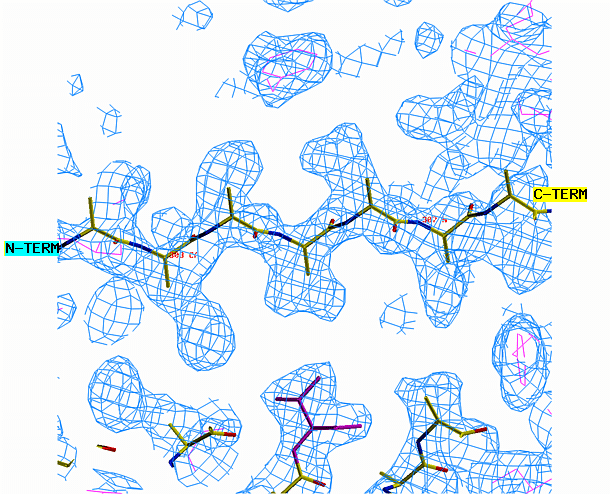
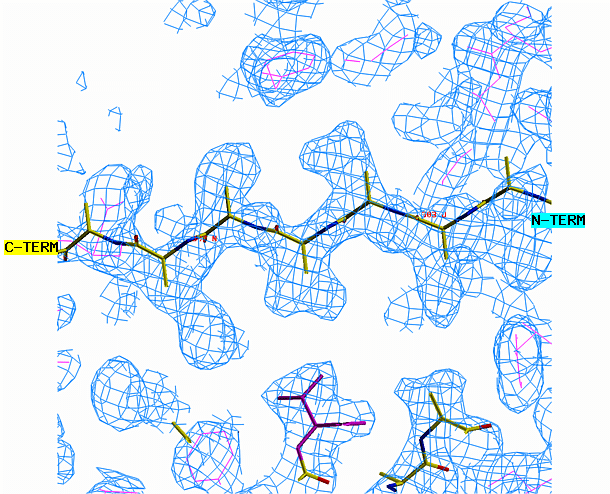
density from three angles. First look at it lengthwise; adjust the
helix to fit the electron density throughout the length of the density.
Change your view by 90 degrees and adjust the alignment again if necessary.
When you are happy with the placement, select YES from the CONTROLS menu.
This will save the new orientation of your helix. In the graphic window type "@mbmacro".
This command will read in a poly alanine starting model and a few libraries
that will aid in model building. Tear off the following sub-menus form
the "menus" menu: Objects, User, Fake Dials. You should be able to see
three objects: the poly alanine model (prok1); the solvent flattened electron
density (dm); and the unit cell outlined in red. You will see two parts
of the density map which contain no model. One area requires a helix,
the other area requires a beta strand. Begin with the alpha helix. Select
from the menu REBUILD , GRAB, GRAB GROUP, the click on the helix. Drag
the helix model toward the corresponding density. Look at the helix
density from three angles. First look at it lengthwise; adjust the
helix to fit the electron density throughout the length of the density.
Change your view by 90 degrees and adjust the alignment again if necessary.
When you are happy with the placement, select YES from the CONTROLS menu.
This will save the new orientation of your helix.
|
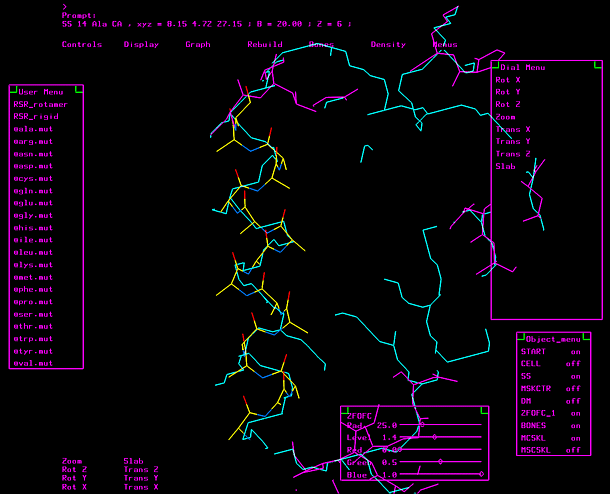
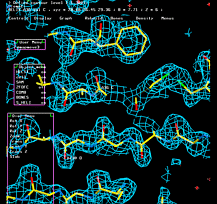
"O" graphics session. Cyan is bones, yellow is a model helix.
Introduction to "O": The
task of model building into electron density maps is most frequently done
with the aid of the graphics program "O" written by Alwyn Jones. The
program contains a number of features than enable the user to build a model
in compliance with the known rules of amino acid geometry. For instance,
when building side chains into a medium resolution map, "O" can suggest choices
amon energetically favorable rotamers to fit a given electron density map.
Also, when building an extended loop, the user may simply chose from a library
of loop conformations collected from high-resolution structures. Despite
these powerful features, the program does contain a number of irritating
buts and the syntax of commands is often non-intuitive. The latest complete manual
for O was written for version 8. Currently we are using version
8. There are also some release notes.
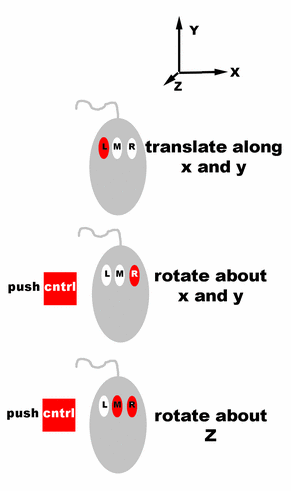
Controls for rotating and translating
groups of atoms in O.
|
 In the graphic window type "@

