Data Reduction
Structural Molecular Biology Laboratory, ChemM230D
|
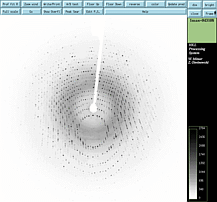 A one degree oscillation photograph
|
Suggested Reading Materials
1)Automatic indexing of rotation diffraction patterns
by Wolfgang Kabsch, Journal of Applied Crystallography (1988), vol. 21, 67-72.
2)Processing of X-Ray Diffraction Data Collected in Oscillation Mode
by Zbyszek Otwinowski and Wladek Minor, Methods in Enzymology, 276, 307-326.
3)XDS/XSCALE
manual, XDSwiki
4) Solvent
Content of Protein Crystals by B.W. Matthews, J. Mol. Biol.
33,
491-497 (1968).
5) Pre-lecture presentation Please read this outline before class.
6) Powerpoint presentation presented in class.
7) Zoom recording of presentation from Jan 12, 2021.
|
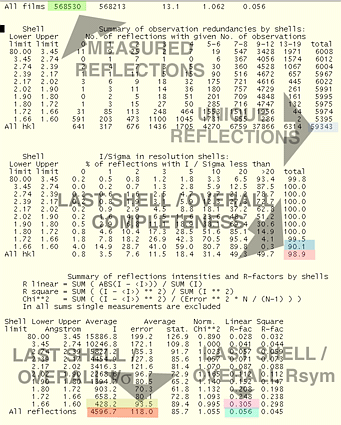
Assignment: Table of Data Processing Statistics
will be completed in lab |
Illustrations
|
| Objective: To produce a crystallographic data statistics
table typically found in structural biology journals.
Method: Copy the format of the table on the left.
Substitute the data from your Scalepack log files for the data in the table.
Report data statistics on the data set that you collected (native, derivative, or PMSF). Submit your Table 1 to Mike or Duilio
when completed .
|

A typical Table 1 for an MIR experiment, adapted from Blaszczyk
et
al., Crystallographic and Modeling Studies of RNase III Suggest
a Mechanism for Double-Stranded RNA Cleavage, Structure, Vol. 9,
1225-1236, December 2001. |
|
|
Part One:
Autoindexing & Integration |
Illustrations
|
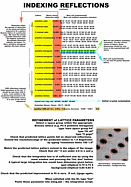
Objective: Define the crystal orientation, lattice and
unit cell parameters for the data set you collected last week.
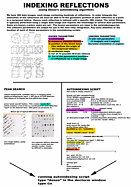
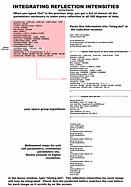
We have 360 data images, each image containing
hundreds of reflections. In order integrate the intensities of the reflections
we must be able to fit the geometric position of each reflection to a point in
the reciprocal lattice. Hence, each reflection is indexed with a specific HKL
value. The initial fitting is typically performed using a single data image and
requires the knowledge of several data parameters. Somer are known
a priori, some are not. The known parameters are input in the autoindexing
script. The unknown parameters are output for use in the next step- integration.
Pay close attention to the location of each of these parameters in the
autoindexing scripts.
KNOWN PARAMETERS
1) wavelength
2) crystal to detector distance
3) position of the direct beam (this defines the origin of the reciprocal lattice.)
4) oscillation angle
5) list of 14 possible Bravais lattices
6) list of the geometrical positions of reflections on a single image
UNKNOWN PARAMETERS
7) unit cell parametsrs (3 lengths, 3 angles)
8) crystal orientation (3 angles)
Procedures
1) Go to your working directory. Display the first image of your
data set. Run the autoindexing script.
2) Choose which Bravais lattice with the highest symmetry consistent
with the observed image(distortion percentage between 0-2%).
3) new space group p43212, fit all @gogo.
4) Judge the goodness of fit of the predicted lattice to the diffraction
pattern (visually, and with chi**2 statistics). If the fit is good,
then most spots should be indexed.
5) Adjust the mosaicity, background and spot size.
6) List parameters, cut and paste into integration script file.
Begin integration for all frames collected |
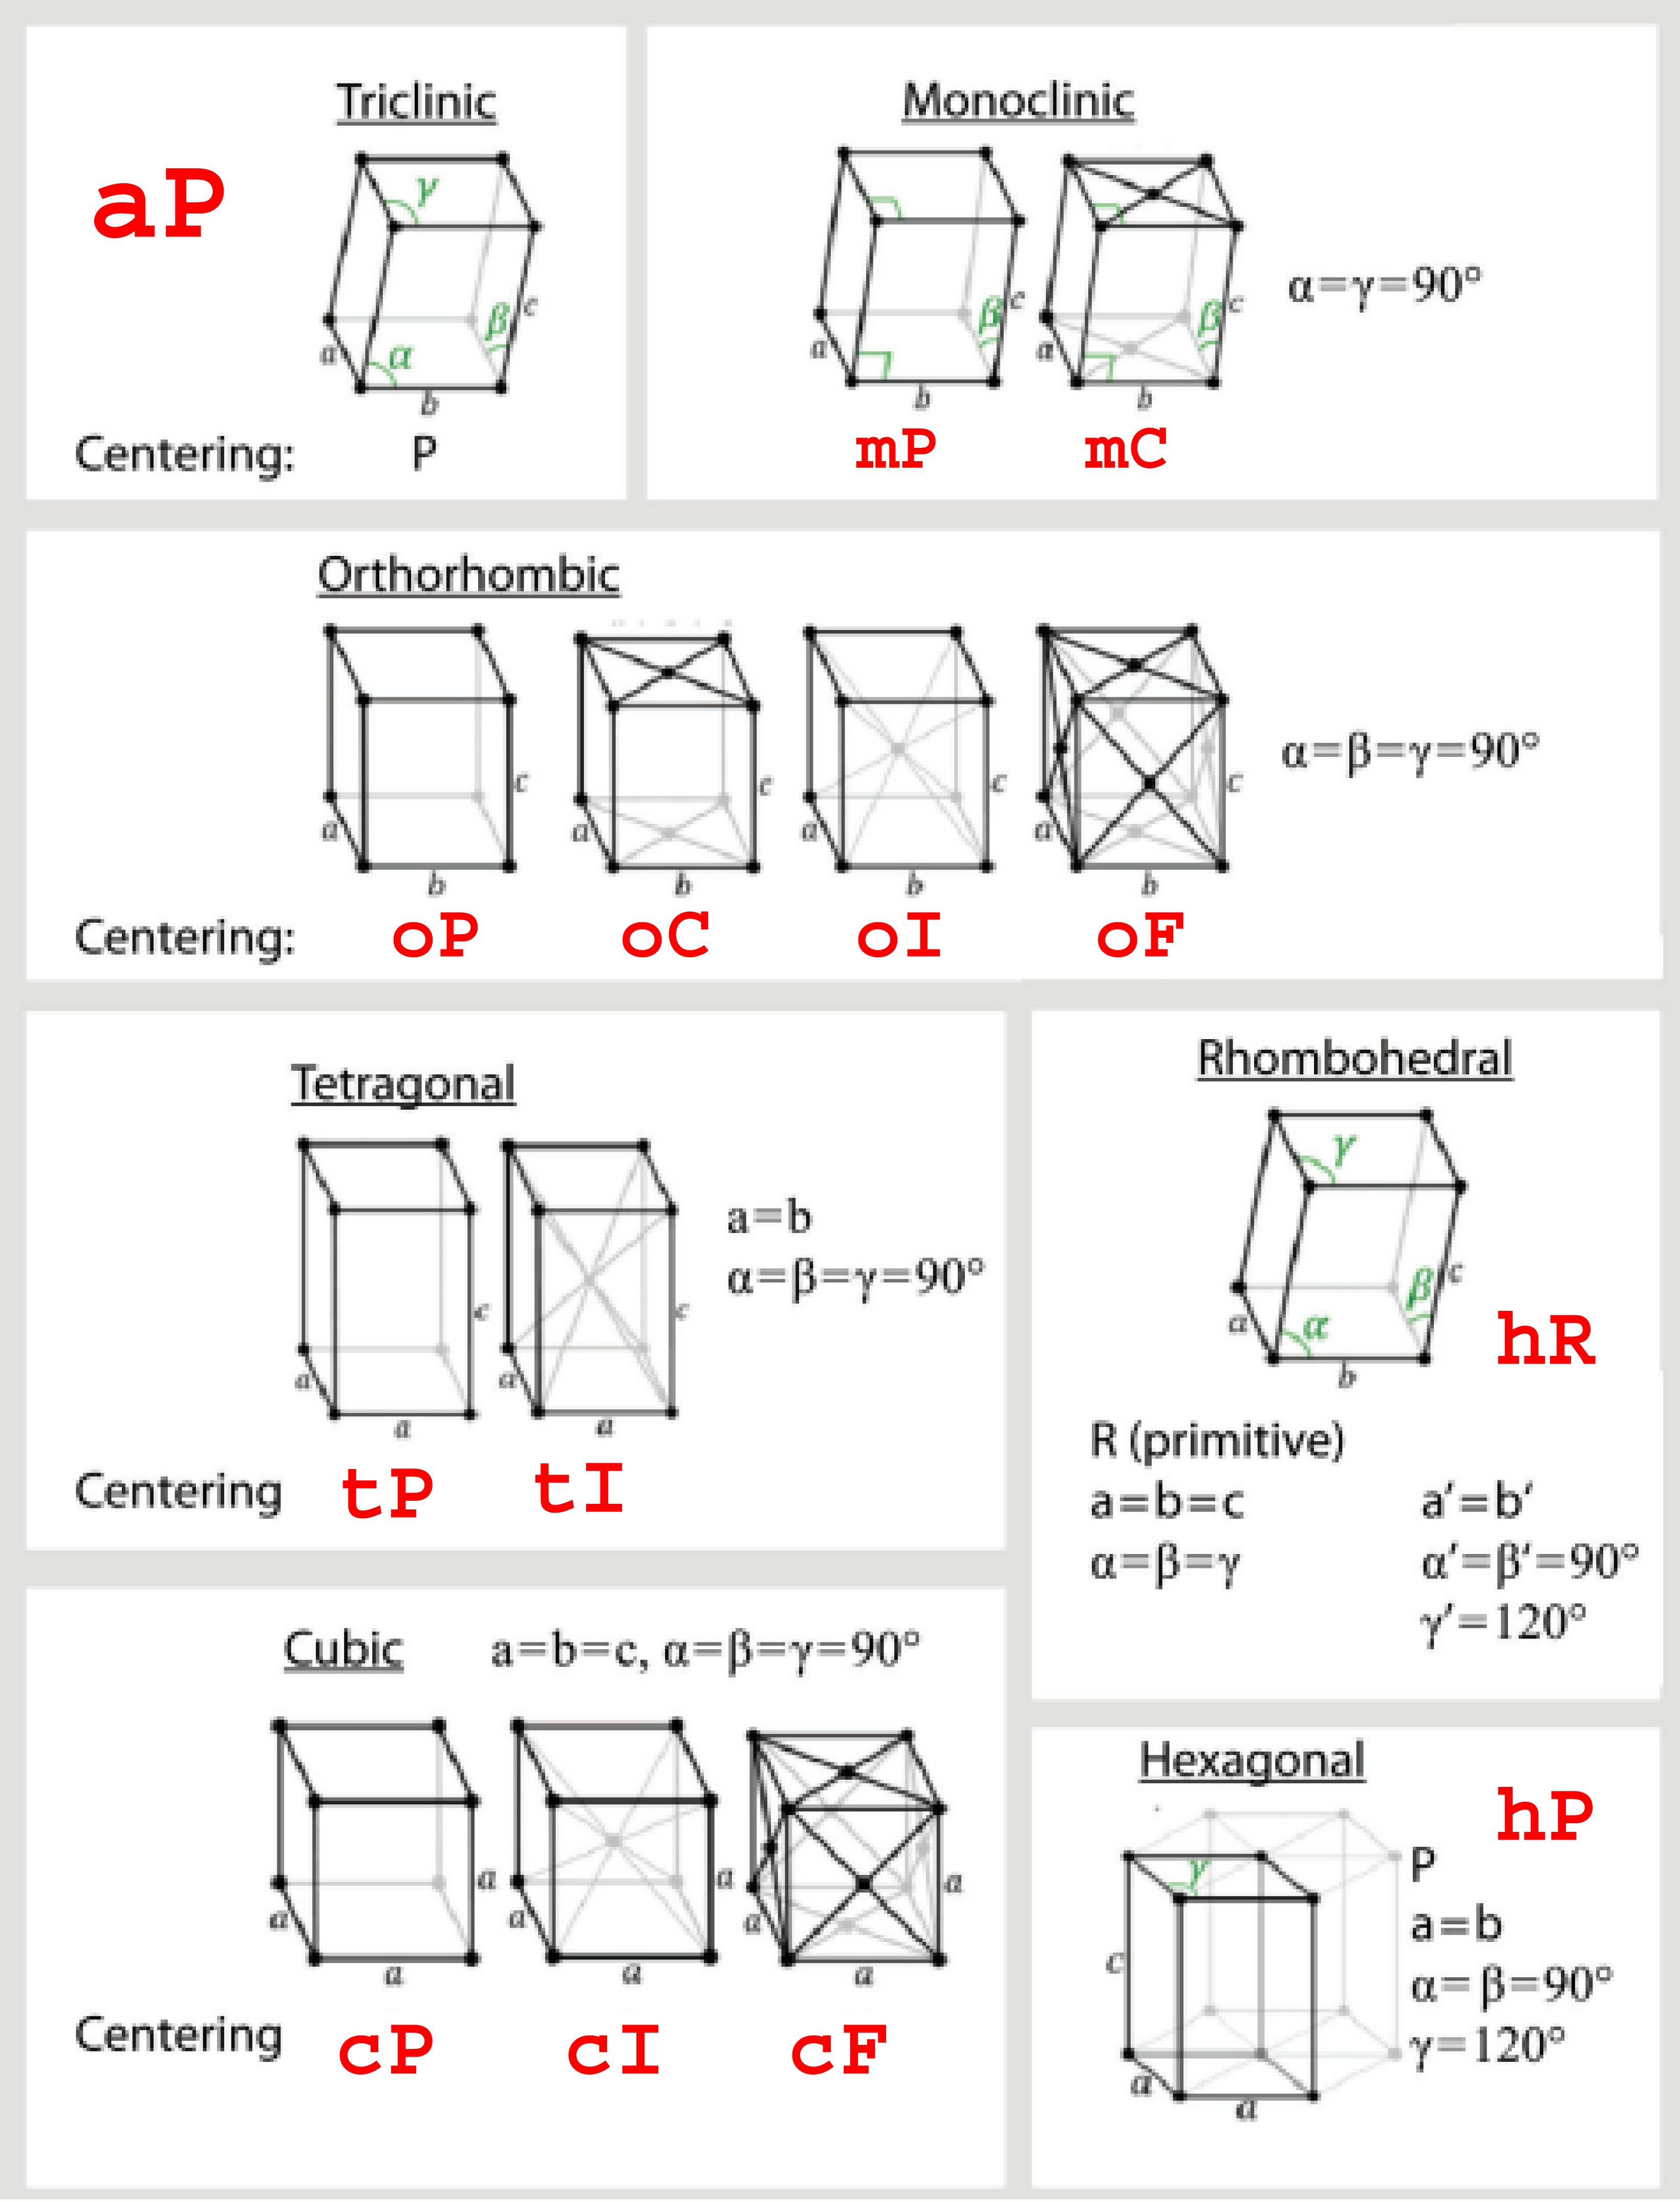
The 14 Bravais lattices
|
|
|
|
Part Three:
Scalepack2mtz |
Illustrations
|
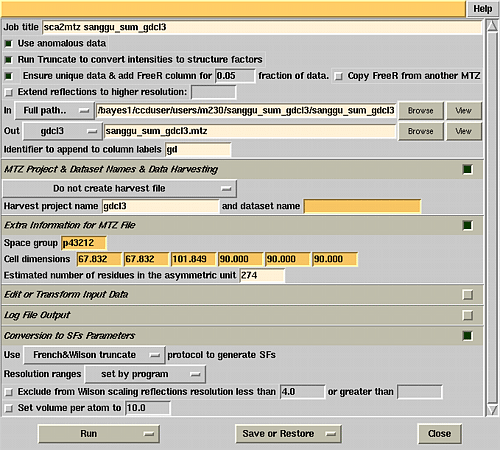
| Objective: To prepare data for the Patterson calculation.
Idea: Next week we will be calculating difference Patterson
maps using the CCP4 crystallographic suite of programs. CCP4 requirs
a specific format for the data set called mtz.
Procedures:
Make a ccp4 sub directory. Go to that directory and type ccp4i.
Go to the programs list window. Select scalepack2mtz. Fill
in the boxes as shown in the illustration on the right. |
 |
|
|
Instructor's
preparations
Back
to CHEM M230D course syllabus
[Overview]
·[Facilities]
· [People]
· [Services]
·[Lectures]
· [BioLinks]
· [Stats]
·[Search]
|
|
|


