EPMR
Evolutionary Programming for Molecular Replacement
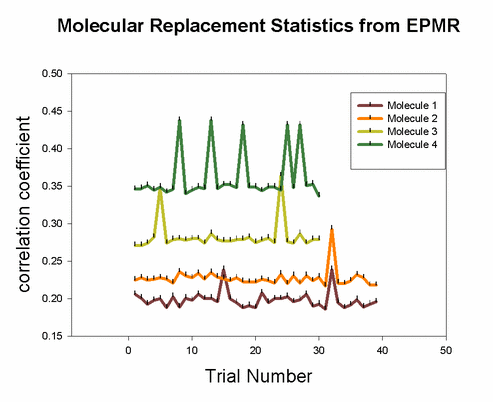
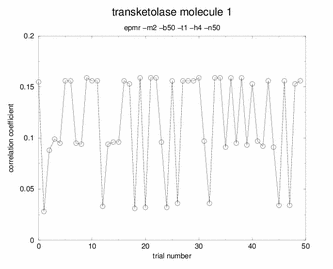
epmr correlation coefficient chart
With EPMR, one tries to find the molecular replacement solution by making several independent attempts (trials). Typically a molecular replacement solution is found within 40-50 trials (plotted on the horizontal axis). Often, several of the trials are successful. Success is gauged by the magnitude of the correlation coefficient (i.e. between the Fcalcs of the potential solution and Fobs). In the example above, we are searching for 8 molecules in the asymmetric unit. Results are shown for the first 4 molecules.  For molecule 1, we see that trial 15 and trial 32 were both successful (dark red line). This molecular replacement solution is held fixed, then  40 more trials are performed  to find the second molecule (orange line).  One by one, the molecules are found then fixed, until all eight molecules are found. The example is taken from the molecular replacement solution of cyt c6.  See Acta Cryst. (2002). D58, 1104-1110.
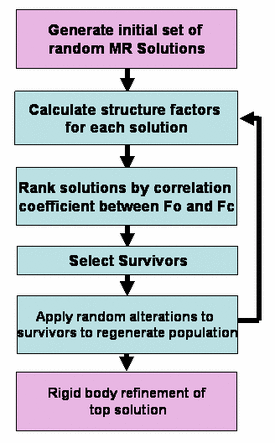
EPMR is an efficient six-dimensional search carried out using an evolutionary optimization algorithm. In this procedure, a population of initially random molecular replacement solutions is iteratively optimized with respect to the correlation coefficient between observed and calculated structure factors. The sensitivity and reliability of the method is enhanced by uniform sampling of the rotational search space and the use of continuously variable rotational and translational parameters. The process is several orders of magnitude faster than a systematic six-dimensional search, and comparisons show that it can identify solutions using significantly less accurate or less complete search models than is possible with two existing molecular-replacement methods. 

Manual for EPMR:
EPMR v2.5 manual

openEPMR v0.2 manual (open source)

Reference for EPMR:
Charles R. Kissinger, Daniel K. Gehlhaar & David B. Fogel (1999) "Rapid automated molecular replacement by evolutionary search", Acta Crystallographica, D55, 484-491.


STEP ONE

Prepare a command script (epmr.com). Prepare a model (model.pdb). Prepare a file containing unit cell dimensions and space group number (cell.dat). Prepare a structure factor file.  Execute the file by typing "epmr.com" or submitting to the batch queue.

Command Script for EPMR.
COMMENTS
#!/bin/csh -f

source /joule2/programs/login

cd /directory/where/this/command/file/exists

epmr -m1 -h4 -l15 -n50 -t1 -b25 cell.dat model.pdb data.fin >epmr.log


EPMR Algorithm in a nutshell
flowchart
The first line is to declare c shell.

Second line sets up the environment variable that tells the computer where the epmr program is located.

Third line specifies the location of this command file.  It is necessary only when submitting to the batch queue.

Fourth line, the epmr command line (bottom), should be a single continuous line.  It may look like two lines here because of wraparound.
 
commonly used flags
(for a list of all flags and full descriptions, see manual.)

-m integer

The number of identical molecules in the
asymmetric unit for which to search.

The default value is 1. The flag -m2 on the command
line would cause the program to search for one solution,
save it as partial structure and continue searching for a
second solution.

-h real_number

High-resolution limit for diffraction data used in the
search (in Angstroms)

The default value is 4.0 Angstroms. We do not generally
recommend that this value be set to less than 5.0.

-l real_number

Low resolution limit for diffraction data (Angstroms).

The default value is 15.0 Angstroms. The efficiency of the
search appears to be aided slightly by the inclusion of
low-resolution data. If you have accurately measured
low-resolution data, you might even try a value of 25 or 30.

-n integer

The number of runs.

The default value is 10. The program will stop before the
completion of the number of runs specified here if a solution
is obtained that has a correlation coefficient that exceeds a
specified threshold (flag -t, below).

-t real_number

The threshold value of the correlation coefficient that indicates an acceptable solution (which will stop the run).

-T

Translation only mode.

-b real_number

The minimum 'bump' distance - the smallest unpenalized distance between the center of mass of a solution and that of any symmetry mates. The default value is 0.0 (no packing restrictions).
Mike says you're a fool if you don't use a bump distance.  In difficult cases it can mean the difference between finding the solution or failure. Measure the smallest diameter of your search model and use this as the bump distance. Please see the manual if you want more details.

STEP TWO

Analyzing the output.

Command Script  for anaylyzing the output of EPMR
COMMENTS
for plotting correlation coefficients

grep CC epmr.log | awk '{printf("%8.3f \n" ,$12 );}' > cc.log

xmgr cc.log
for plotting R-factors

grep CC epmr.log | awk '{printf("%8.3f \n" ,$14 );}' > r.log

xmgr r.log


EXAMPLES

good
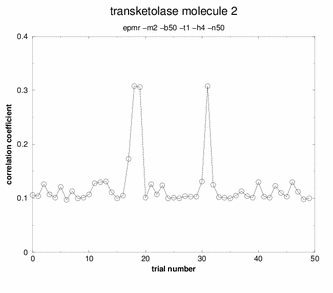
Peaks! Three of the solutions stand out above all the others. Any of these three solutions would be correct.
ok
Yes, this run produced a correct solution.  Shocker!  The CC is so low!  Perhaps the give away feature is that so many of the solutions share the exact same "high" correlation coefficient. The appearance is that of a plateau.

bad
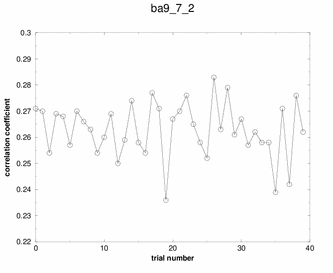
Booh! Hisssss!  No spikes, no plateaus.  Just random garbage.

Although many potential solutions are calculated, EPMR will output only the solution with the highest correlation coefficient (unless otherwise specified).  It is wise to check what its correlation coefficient is.  You would hope that for a correlation coefficient over 35%.  But, the ultimate test of whether the solution is correct is to demonstrate that you can refine the structure with a concommitant drop in the free R factor.


During the EPMR calculation, one may wish to check the progress by plotting the correlation coefficient (CC) as a function of the trial number. This simple script on the left will extract from epmr.log a list of the correlation coefficients and put them into a file called cc.log.  You may plot the file by typing "xmgr cc.log".  You will get a graph like the graphs shown on the left. It is always encouraging to see a spike in the graph.  But this is not a necessary feature for a correct solution.


What do I do if EPMR does not produce a solution?  You could try running the program with different resolution ranges. Instead of 15-4Ang, try 15-5Ang.  You could also try more runs (-n100). Or try the conventional rotation/translation functions.  A different algorithm might do the trick.


[Overview] ·[Facilities] · [People] ·[Services] ·[Lectures] · [BioLinks] ·[Stats] ·[Search]