4) Radiation
Safety Guidance from the Department of Environment, Health & Safety,
Radiation Safety Division, UCLA.
5) A table specifying the minimum concentration of glycerol
to be added to solution 1 to 50 of the Hampton Screen is available in PDF
format. Original
reference is Garman & Mitchel,J. Appl. Cryst. (1996). 29 584-587,
and included in a cryo kit from
Hampton.
8) Crystallify Visualize Bragg planes and Space Group Symmetry.
Laboratory Procedures
Part One: Cryogenic Crystal
Recovery Techniques
Illustrations
Objective: To store a crystal for shipping
to a synchrotron and then restore it to the goniometer head undamaged.
Caution: Wear gloves during the crystal storage
for protection from the extreme cold of liquid nitrogen.
Procedures:
To remove the crystal from the goniometer head for storage, fill a
short dewar with liquid nitrogen. Place the head of the cryotongs in
the nitrogen until it stops boiling. Clamp the tongs around the
crystal and quickly return the crystal to the liquid nitrogen in the dewar.
Clamp the cryovial with a pair of forceps and dunk it in the liquid nitrogen.
The cryo-pin is pierced with small holes (to allow gaseous nitrogen to escape
without popping the cryopin off the top of the vial.) With another
pair of forceps clamp the base of the cryopin, and release the crystal from
the cryotongs. Transfer the crystal to the cryovial. The crystal
must remain under liquid nitrogen surface during the entire procedure.
Slight warming of the crystal after it is frozen will often cause loss of
diffraction. Screw the cryopin onto the vial using the magnetic wand. You
may need to use your fingers to tighten the screw.
Part Two: Cryocooling
Procedures
Illustrations
Objective: To learn how to screen for
cryo-protection conditions. Cryoprotect crystals. Flash freeze crystals
for data collection, and store them in vials for synchrotron trips.
Method: Cryoprotectant (in this case glycerol)
is introduced into conditions resembling the mother liquor composition.
The effectiveness of cryoprotection is evaluated by looking for a clear (not
opaque) freeze of the cryoprotected solution in the cryostream.
Once a suitable condition is found, the crystal is quickly dipped in the
cryoprotected mother liquor and judged for diffraction quality. Remove
the crystal, place it in a cryo vial and store it in a nitrogen dewar.
Caution: Wear gloves during the crystal
storage for protection from the extreme cold of liquid nitrogen.
Procedures:
1) Watch the 10 minute video on cryocrystallography from the Ealick lab at
Cornell.
2) At the microscope, select a crystal that you would
like to use for data collection. Gently lift the cover-slip and
remove 7 uL of reservoir. Deposit the reservoir solution on a glass
cover slip . Take a cryoloop and dip it in the cryoprotected solution.
Place the loop on the goniometer head under the cryo stream. Look through
the microscope or video monitor to see if the film in the loop is clear or
opaque. If it is opaque, add 3-3.5 microliters of glycerol to the drop
and check again for clarity upon freezing. normally, one would like
to use the minimum amount of glycerol required to provide cryoprotection
because too much glycerol could destroy the crystal.
3) Select a crystal, and lift it out of the drop
with a cryoloop. Transfer the crystal to the cryoprotected reservoir
solution and swish for 1 second. Lift the crystal out of solution and
bring it near the cryostream. Block the stream with a ruler or buisness
card. Place the loop on the goniometer head. Then quickly unblock
the cryostream. Cryocooling is successful only when done quickly, hence
the term flash-freezing. The speed of flash freezing prevents formation
of crystalline ice, which disrupts the crystal lattice and degrade the data
quality.
4)Take a diffraction image to check for crystal quality.
5) To remove the crystal from the goniometer head for
storage, fill a short dewar with liquid nitrogen. Place the head of
the cryotongs in the nitrogen until it stops boiling. Clamp the
tongs around the crystal and quickly transfer the crystal to the liquid nitrogen
in the dewar. Clamp the cryovial with a pair of forceps and dunk it
in the liquid nitrogen. The cryovial should be clearly labeled. Use
a magnetic wand to hold the base of the cryopin, and release the crystal
from the cryotongs. Transfer the crystal to the cryovial. The
crystal must remain under liquid nitrogen surface during the entire procedure.
Slight warming of the crystal after it is frozen will often cause loss of
diffraction.
Tools and Equipment:
A crystal mounted in a cryoloop, of a cryopin placed in the cryostream.
Part Three: X-ray
Equipment and safety
Illustrations
Objective: To understand the operation
of x-ray equipment and use it safely.
Method: Read the description of
the equipment used in the diffraction experiment.
Rigaku FR-E rotating anode X-ray
generator : There are two types of x-ray generators commonly
used by protein crystallographers today, rotating anode generators and synchrotron
radiation sources. Crystallographers prefer to use synchrotron
radiation because it is 10 to 1000 times more intense than radiation from
rotating anode generators. The result is stronger, higher resolution
data. The wavelength of synchrotron radiation is also tunable, which
allows optimization of anomalous scattering data for MAD or MIRAS phasing
techniques. However, there are only six synchrotrons in the US suitable
for protein crystallographers. They are large (the size of a shopping
mall), government funded facilities, operating with a full staff 24 hours
a day. Using a synchrotron is costly in time and travel expenses, and
requires months of planning ahead. Rotating anode generators have the
advantage of being commercially available and fit in a typical lab space.
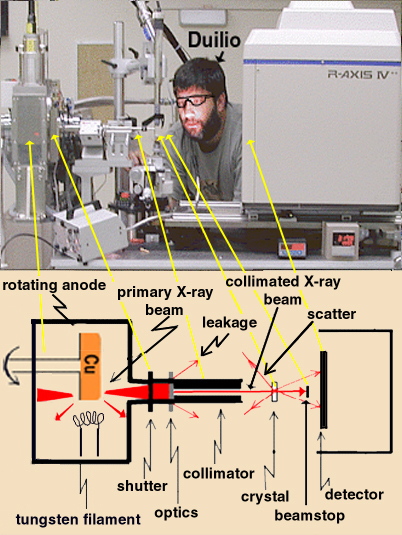
The production of X-radiation by rotating anode
generators begins by passing a current through a tungsten filament (show
filament), typically 50kV, 100mA. Electrons are ejected from the filament
and accelerate toward a copper anode (show anode). The energy
from the electrons is absorbed by the copper atom thus ejecting an electron
from the inner shell (K-shell). An outer shell electron (L-shell) then
falls into the inner orbit (K-shell), emitting radiation of 1.5418 Angstroms
wavelength. The particular wavlength emitted is a property of copper's
L to K electronic transition and can be changed only by replacing the Cu
anode with a different metal coating which will have a different electronic
transition.
The intensity of the x-rays generated is limited
by how quickly the heat can be dissipated. The rotating x-ray generator
you are using produces a more intense beam than most other generators because
it has a larger than average copper anode. The larger copper surface
distributes the heat over a larger area, keeping the temperature down so that
more xrays can be generated with a smaller focal size. The anode rotates so
the heat can be dissipated over the entire cyllindrical surface and water
is circulated through the inside of the (hollow) anode for further cooling.
The production of x-rays takes place in a vacuum because air molecules would
interfere. Maintenance can be difficult and time consuming because
bitter enemies (high voltage, water, and vacuum) often refuse to coexist
peacefully in a small space .
A red light on the generator signifies that X-rays are
being produced. X-rays are continuously generated except during maintenance
periods. X-rays are not permitted out of the sealed tower (see tower in the
figure on the right) unless a shutter is open by flipping a switch.
A collimator and optics system help collimate and focus the beam on the crystal
sample. A beamstop absorbs all non-diffracted x-rays (see schematic
on right). Do not touch the x-ray collimator or beamstop, it could
missalign the beam geometry.
Goniometer assembly: The crystal
is held in a loop at the tip of the cryo-pin. The metallic pin sits
on a magnetic base which is attached to the goniometer head. The goniometer
head is a delicate instrument that can be translationally adjusted (in 3
dimensions) to bring the crystal into the x-ray beam and center it on an
axis of rotation (omega) defined by the goniometer. The goniometer rotates
omega slowly during data collection to bring different reflections into diffraction
position. It is absolutely crictical that the translation screws on
the goniometer head be adjusted so that the crystal is centered in the x-ray
beam throughout 360 degrees of rotation in omega. Mike or Duilio will demonstrate
this centering procedure.
X-ray Detectors: You will be using
an
Raxis IV++ imaging plate detector (as pictured above).
Imaging Plate detector: The measurement
of diffracted x-rays with an imaging plate detector is a two step process.
Step 1. Exposure to x-rays and creation of the
latent image. An x-ray photon is absorbed by the phosphor matrix and
the energy is transferred to a number of Eu2+ sites. Eu2+ is oxidized to
Eu3+ and a photoelectron is ejected into the conduction band. The photoelectron
becomes trapped in a lattice defect created by the absence of a halogen (F
or X) counter ion. These vacancies are created during the manufacturing process
andare called F-centers or color centers.
Step 2. Recovery of the latent image. HeNe
laser light (l = 632nm) is used to irradiate the IP to generate the photostimulated
luminescence. The visible light photons excite the trapped photoelectron
in the F-center into the conduction band where it recombines with the Eu3+
in less than 0.8 m seconds, releasing a visible light photon at l = 400 nm.
The wavelength of the luminescence is well matched to the detection capabilities
of bi-alkali photo-multiplier tubes (PMTs), which have a sensitivity range
of about 300 nm to 600 nm. The readout process removes 80% to 90% of the
stored image. In order to prepare the IP for reuse all the F-centers must
be depopulated. This is accomplished by bleaching the IP with visible light
whose spectrum has been adjusted to enhance this depopulation.
Comparison of imaging plate to CCD detector.
Image plate (IP) detectors are the general
purpose workhorses in protein crystallography. They have a large active surface,
sufficient spatial resolution, and are relatively affordable. Their main
drawback is that readout (1 minute) is not as fast as the electronic detectors
(15 seconds). This is not a real concern at home where exposure times (5-10
minutes) are much longer than the readout times. However, at modern synchrotrons
IP detectors are just too slow.
CCD detectors are almost the opposite
of IP detectors; they are very fast( 30-90second exposures), have a small
active surface and are expensive. They also "suffer" from time-dependent
noise; both dark current and zingers. CCD Detectors with a larger active
surface are made by coupling the detector to a fiber optic, and by tiling
multiple CCDs together. CCDs shine when very intense signals are collected
very rapidly, i.e. at a synchrotron. In this situation time-dependent noise
is small and you really need the readout speed.
CCD detector: CCD stands for charge-coupled
device. They operate on the principle of localized light-induced charge accumulation.
The three main components of the
Quantum CCD detector are
phosphor screen (to convert X-rays to visible light), fiber-optic taper (to
demagnify the light image down to the size of the CCD chip), and CCD chip
to detect the light image as an electric charge image. The electric
charge image is read out of the CCD chip and digitized (converted to
binary numbers) then fed into a computer. After geometric and intensity corrections
are applied, the resulting data are similar to data from other types of X-ray
detectors and can be processed by most standard software packages.
-adapted from
Bart Hazes diffraction tutorial.
Photo ofdiffraction equipment (as viewed from the side) with corresponding
schematic (as viewed from above).
Goniometer head assembly.
How an imaging plate works
at various stages of recording and image.
Contents of the R-axis IV++ imaging plate housing
shown next to Duilio in Figure 1above.
Part Four: Data
Collection Strategy
Illustrations
Objective: To optimize data collection
parameters to obtain measurements with high redundancy, high completeness,
and high signal to noise.
Method: Once a satisfactory cryocooled
crystal has been mounted, there are a number of practical considerations
and decisions that have to be made about data collection strategy. These
are listed below.
Detector
distance
Where should you place the detector?
near or far from the crystal? There are 3 factors to consider: the resolution
of the diffraction, the pixel resolution of the detector, and the absorption
of the x-rays by air. If a crystal is diffracting well, you would like
to move the detector close to the crystal to capture the high resolution
spots --the closer the detector, the higher the Bragg angle intercepted by
the detector. However, at some point, the limited resolution of the
pixels on the detector will be unable to separate one reflection from its
neighbor. This is epecially true if the unit cell of the crystal is
large, the reciprocal lattice will be closely spaced. Moving the detector
far from the crystal may cause you to miss the high resolution reflections.
In this case, you would need to rotate the detector (2theta) angle to intercept
the high resolution reflections. The solution is to move the detector to
the point where you see a reasonable separation of spots. If you need
to move the detector further than 300mm from the crystal to resolve large
unit cell, then you should consider using a helium box to lessen the absorption
of x-rays by air.
Exposure
time
How long should you expose per image?
Theoretically, the longer the exposure, the better the counting statistics
(i.e improved signal to noise). The length of the exposure is especially
important for weaker reflections at high resolution. However, there
are limits imposed by the physics of the detector, the patience of the crystallographer,
and the impatience of the crystallographers waiting behind you for beam time.
Detectors can be saturated, this event is indicated by yellow pixels in the
images taken on the CCD. The dialog box also indicates the number of
pixels with "overflows". After 20 minutes, imaging plates begin to
lose the latent image before the image is developed. Typical exposure times
at our X-ray facility are in the range of 1-2 minutes.
Oscillation angle
Through how many degrees should the crystal rotate during
a single exposure? Data are usually collected in snapshots taken during
a small rotation of the crystal (phi angle). The larger the oscillation
angle, the more reflections are collected on a single exposure. However,
if the oscillation is too big, reflections will overlap on the film.
Those overlapped reflections would have to be omited from the final data
set. Overlap is especially a problem for large unit cells, where the
reciprocal lattice points are closely spaced. Typical oscillation angles
are 2 degrees for DNA crystals, 0.5-1 degrees for protein crystals.
Total
number of degrees of data collected
Through how many degrees should the crystal rotate
before ending data collection? The minimum number of degrees of rotation
is dictated by the space group symmetry and crystal orientation. Knowing
exactly how to collect the unique set of reflections in the minimal amount
of time used to be of the utmost importance before the advent of cryocrystallography;
x-rays quickly damage a crystal at room temperature . However, significant
improvement in signal to noise can be gained by collecting more more data,
up to 360 degrees. With cryo cooling, decay is rarely a problem.
Diffraction simulation: To develop
your intuition about Ewald's sphere, and the reciprocal lattice, run excercise
1 and exercise 4 with XRayView, the interactive computer graphics software
package. Explore the inverse relationship between the unit cell and
the reciprocal lattice. Understand how overlap can occur during data
collection.
A movie compiled from diffraction images. Each image (frame) contains the
sum of diffracted intensities as the crystal is rotated over a 1 degree oscillation.
In total, the movie covers 60 degrees of crystal rotation about a vertical
axis. Taken from James Holton's web site http://ucxray.berkeley.edu/~jamesh/movies/.
Originated by Bernal but more popularly known as Ewald's sphere.
